Introduction to Network
Network is an original feature of Publycics. Allows all Business or Enterprise subscriptions to use the Publytics dashboard to control more websites at the same time!.
This feature is highly used among all our users because it gives a complete and deep analysis of an entire network or sub-network of websites. You can perform direct analysis on your websites filtering for custom and standard dimensions, Generating complete reports. You can also export the PDF or the CSV files from your tables (as you do for the single website) for all your network.

It comes with a limit of 3 Networks for the business subscription and Unlimited networks for the enterprise subscription. It means that a maximum of 3 different groupings of various sites (networks and sub-networks) can be created for a Business subscription (Unlimited for Enterprise).
For example, it can be very useful to group the various sites into different networks according to the themes of those sites, but, at the same time, also to have a network grouping all sites of various genres.
Let's get deep into the network environment!
Network: distinctive features
If we already have a network (if you don't have a network yet create a new network) we can easily switch from single site to network environment with the switch to network button on the navbar.

This button allows you to switch from your Site view to the network environment preserving all session data (page and time range). Because of that you can not switch from a page existing for single sites but not for network.
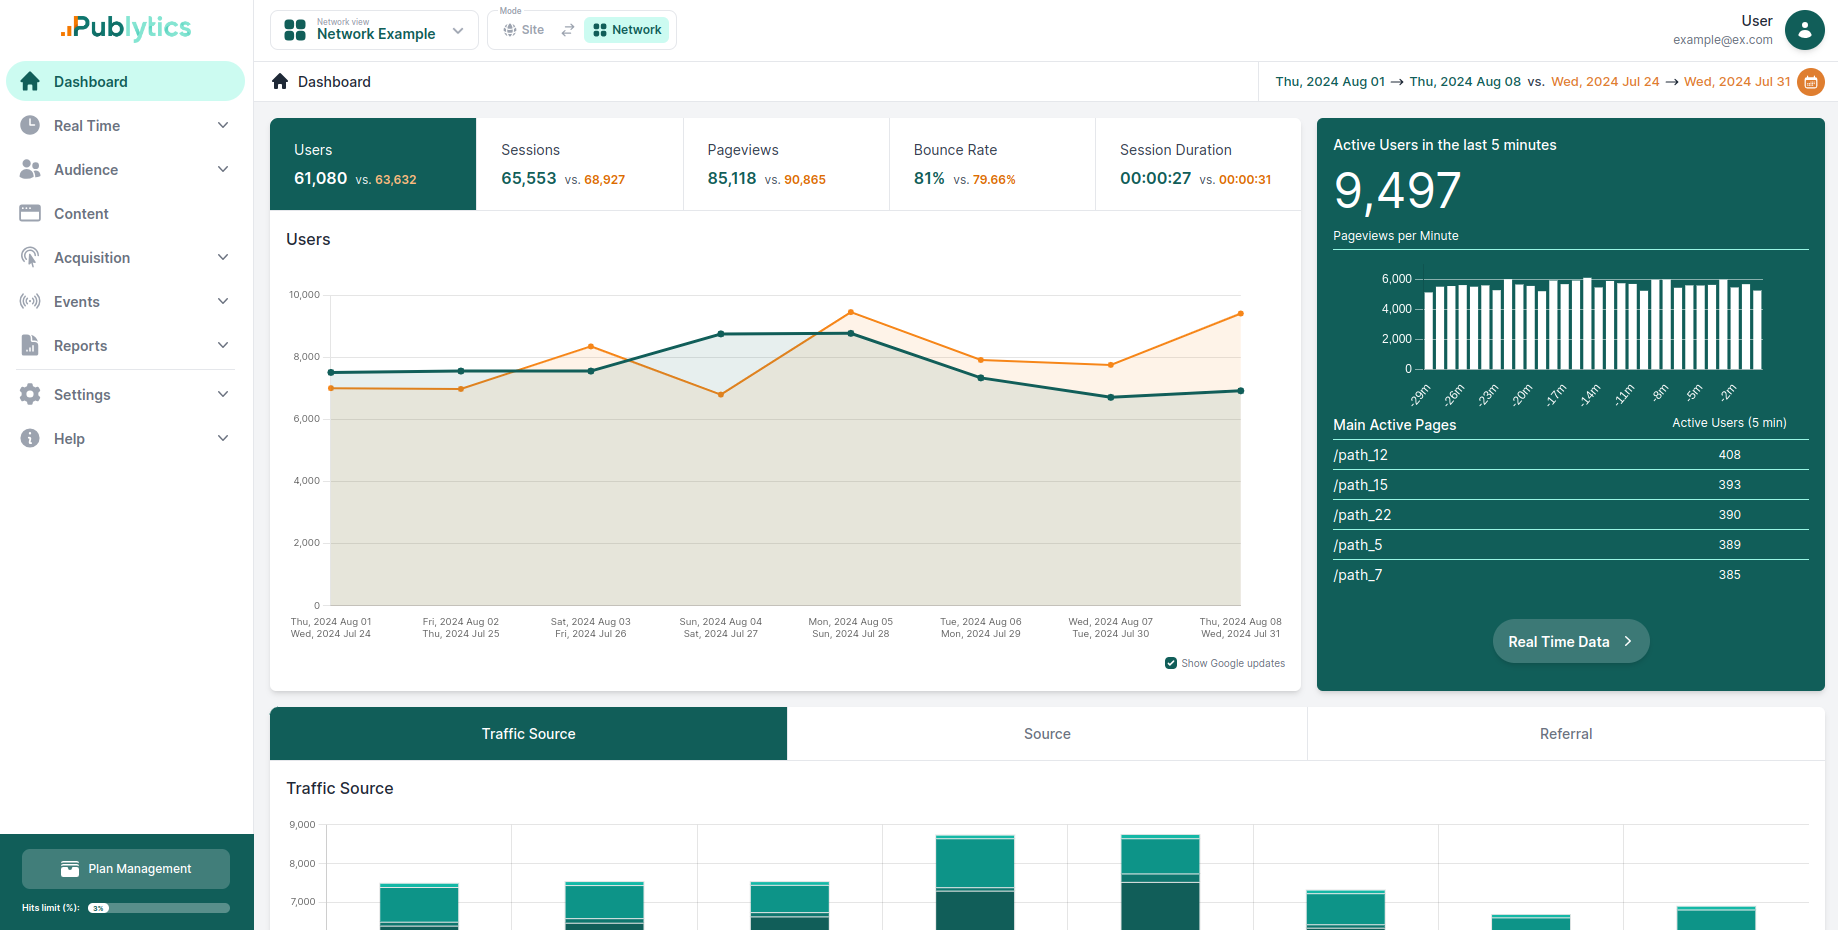
As we said before the network enviroment is an exact copy of the single site dashboard, but with more details and filters.
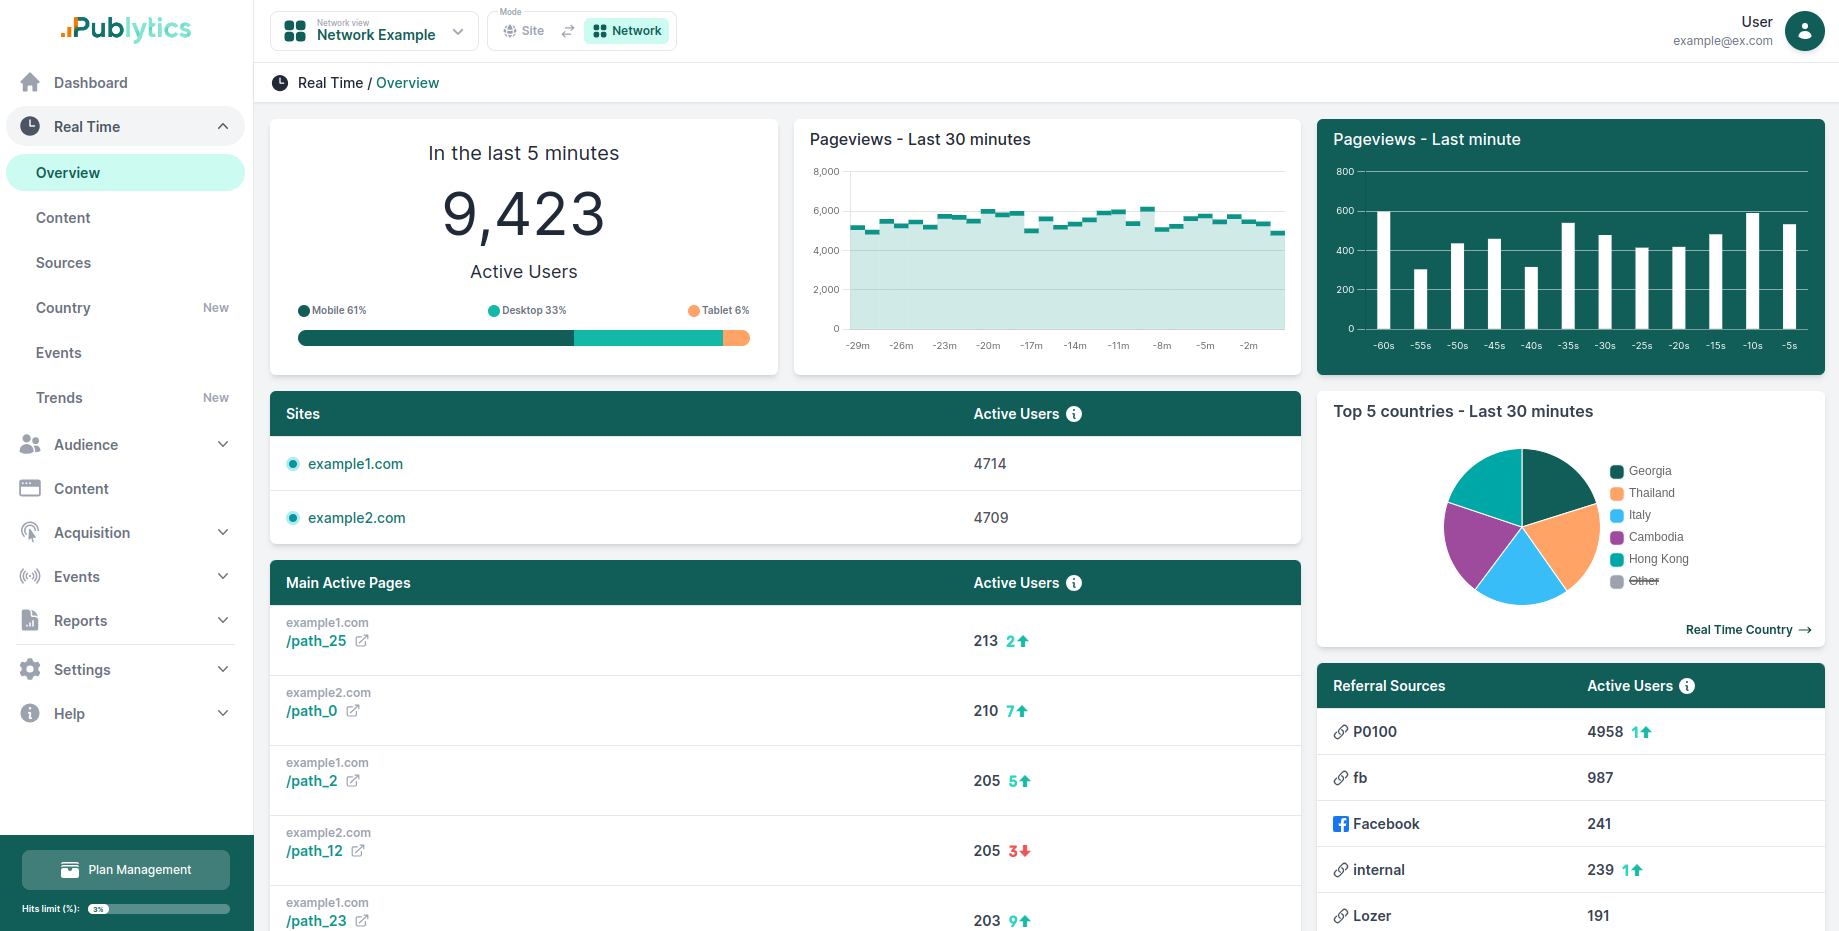
On each page, in fact, there is the possibility of distinguishing from which site pageviews, events, etc. are arriving, as for realtime overview, where we have an additional table dedicated to the realtime visits of individual sites.

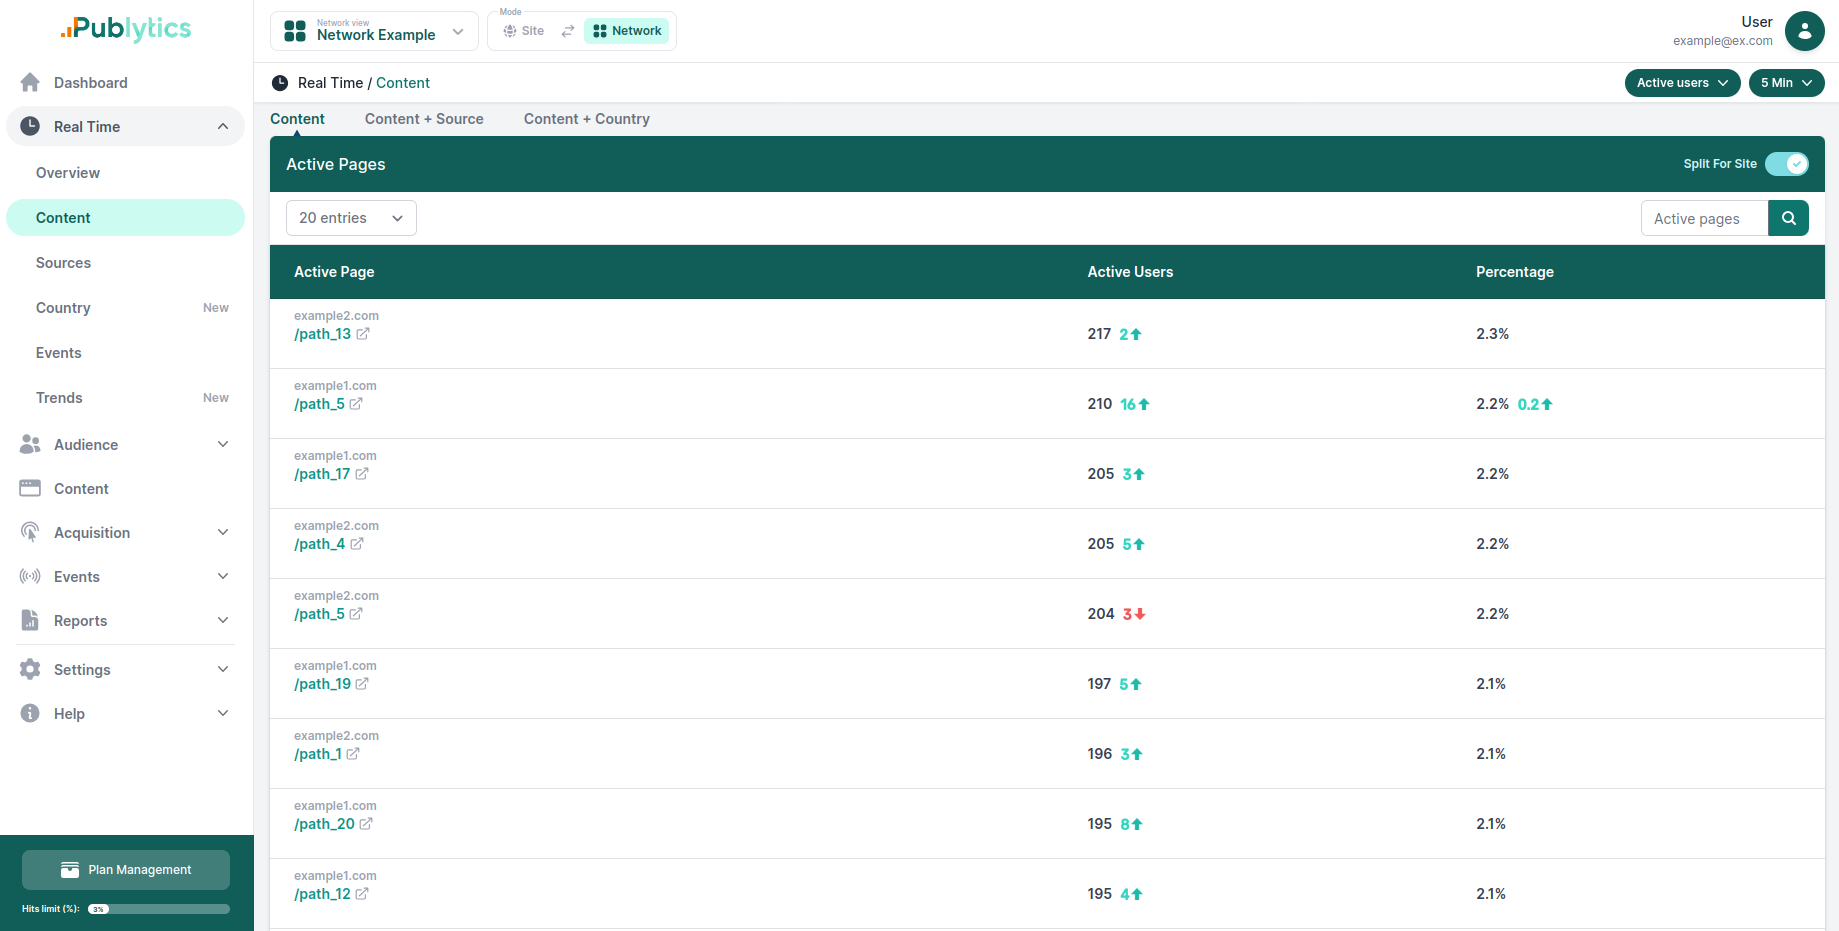
On the other hand, in the other pages of the realtime section, we have the option of applying the ‘Split for site’ filter (at the top right of the table), which allows us to decide whether to distinguish table entries for each individual site, or to aggregate them.

In this page in fact we can see that every entry is labeled with the site name because the Split for site option is active.
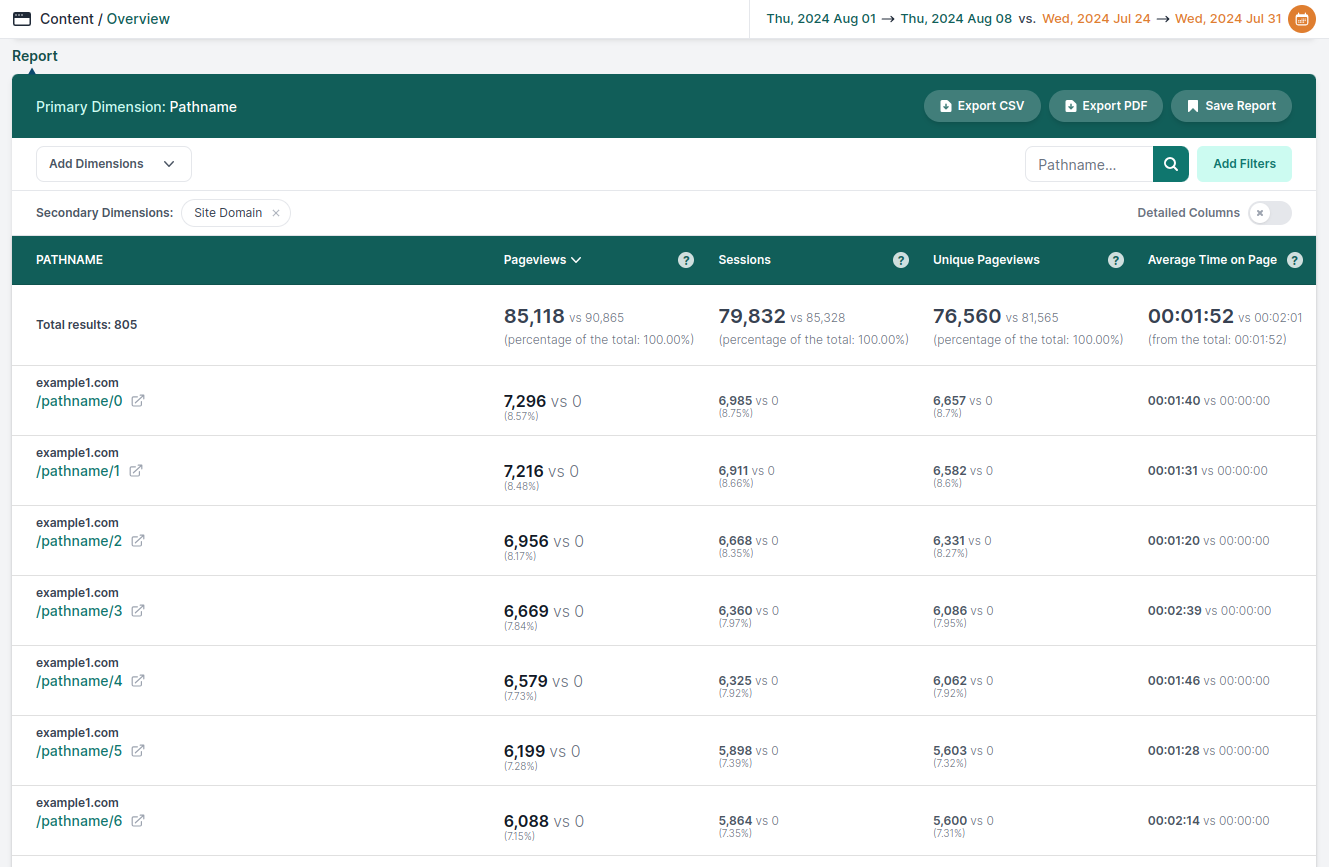
In the same way we can see this option also in the fixed tables like content, events and acquisition. Here we can see the site domain in form of secondary dimensions. Every time we visit one of this pages in the network environment we can see that the dimension Site domain is active. It allows us to see for example to which site a pathname belongs, like in the content table.

We can just remove it just by clicking on the dimension (like for every secondary dimension).

